Ahead of the publication of the latest incarnation of the Communications Data Bill, due out tomorrow, I thought I’d take another look at how the UK compares with other countries when it comes to the number of requests for user data. There are many articles that quote the raw numbers and the US invariably comes out top in those terms – with a population of well over three hundred million people, that’s hardly surprising.

Instead, I look at the number of requests per million population – i.e, as a citizen how likely is it that someone such as the courts or police will be looking at my data. The UK has an unenviable record in this regard, topping the charts as the most-spied on population back in 2010. The UK remained top in Europe until the latter half of 2012, when France just managed to get ahead – a trend that was repeated in 2013.

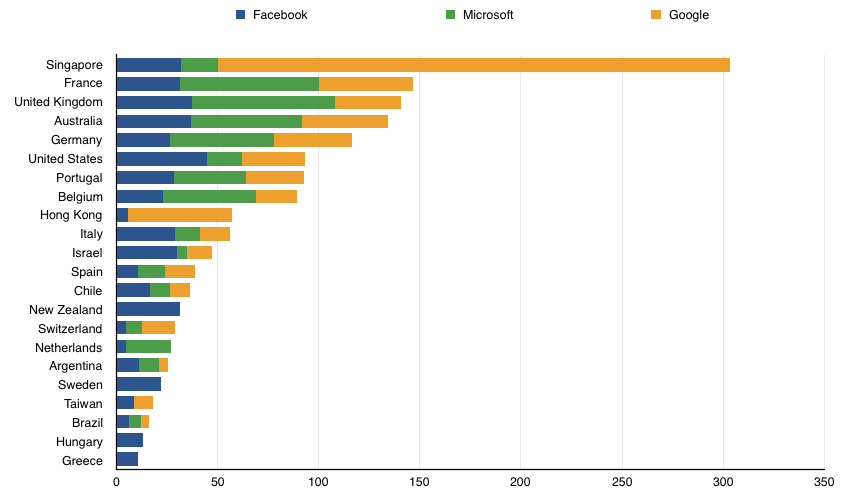
Since then, more data has been made available. Originally, only Google produced data but many other companies have followed suit. The big three who publish useful data, in terms of requests received, are Google, (Including Google Plus) Microsoft (Including Skype) and Facebook. Below is the chart for the latter half of 2014, which is the latest period for which full data is available. France and the UK are still neck-and-neck on user data requests per million population, beaten only by Singapore’s recent obsession with collecting data from Google.
Legal Requests graph 2014H2

User data requests per million population – July-December 2014

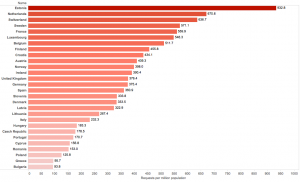
The European “right to be forgotten” has been in the news recently as it has been a little over 6 months since Google launched their formal process, allowing individuals to request the removal of search results for their name. But which Europeans are most and least likely to request removal from Google search results?

Germany, the UK, Italy and France all feature highly based on raw numbers, but that is to be expected given those are also the most populous countries. Looking at the numbers based on population the answer is, surprisingly Estonia. Unless some Estonians are submitting more than one request, which would be odd given one request can list multiple URLs to be removed, nearly one in every thousand Estonians have contacted Google requesting removal. At the other end of the scale, Bulgarians are the least likely to want to be forgotten with less than one request in ten thousand people with Greeks being close behind.

The UK comes right in middle of the pack. Despite the national stereotype, it appears we are no more shy than any other Europeans when it comes to having our details online.

Right to be forgotten

Technical notes: Analysis is based on Google data as at 8th December, using World Bank population estimates from 2010. Countries with a population of less than 500,000 (Liechtenstein, Iceland) have been removed.

I have been looking at transparency report data again recently, a task that is long overdue. The big change is that more data is available on government and law enforcement requests than used to be the case, when Google were the only company producing reports.

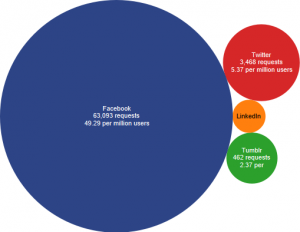
The most interesting category is, for me, social media networks. Unfortunately, only four major networks produce data that is independent – Facebook (Including Instagram), Twitter, LinkedIn and Tumblr. (Google+ comes under Google and Skype under Microsoft) So, which network is receiving the most queries for data per user? Before running the numbers, I would have expected networks to receive requests proportional to their size but this is far from true – the graph below is adjusted to take into account the number of users each site has and is based on requests from July 2013 to June 2014.

Social Media Networks - Data Requests
(Interactive version)

This discrepancy may be because of the kind of requests law enforcement is issuing. Although Twitter is far more political than Facebook, most serious crime is not political or terrorist – it’s run-of-the-mill violence. The bulk of (Non-piracy-related) requests received by Internet and Telephony Service Providers relate to people who had been assaulted, and the police were attempting to find out who the victim has communicated with recently. Although quite nasty threats are far too common on Twitter, Facebook “friends” are the kind of people who will be close enough to actually carry out threats, so will likely be the first port of call for police.

For the usual analysis of data requests per-country, Facebook alongside Microsoft and Google, but dropped Twitter due to their small size.

Sadly, many of the smaller companies are only permitted to release very vague figures by the US government which makes them all but useless – it is not particularly helpful to know that a network received some requests in a six month period, but that it was less than 1,000 requests.

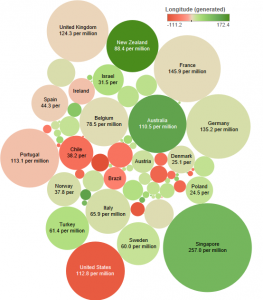
The charts below are based on the first half of 2014 and adjusted for population size, and countries with a population below 2,000,000 (Where a handful of requests can skew the results) have been excluded.

User data requests per country (Population adjusted)
(Interactive version)

User data requests per country (Population adjusted, bar graph)
(Interactive version)

The UK is still an unenviable fourth in the league tables of most-snooped-on population, although we have dropped below Germany and France. (Malta and Luxembourg have been excluded this time as smaller countries, but did appear on the 2013 charts) The surprise first place, having not had a particularly bad data request rate in the past, is Singapore who have added

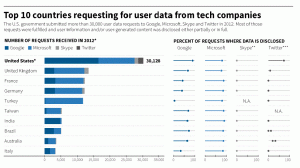
In the last few days, Reuters have produced a graph titled “Top 10 countries requesting for user data from tech companies“. It’s been circulated widely, having been picked up by Techspot, ISPreview, Gizmodo, io9 and others.

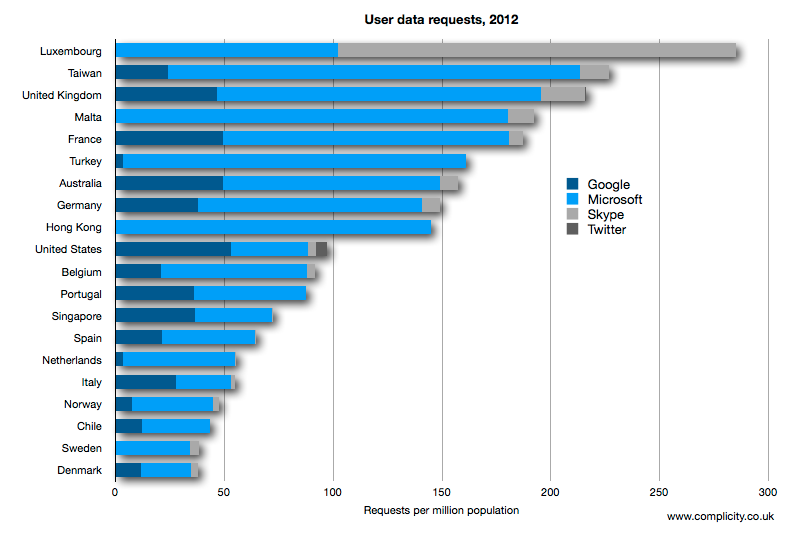
It is also very misleading because it reports the absolute number of requests, ignoring the relative size of the countries concerned. I have covered this before with Google’s transparency report, analyzing the data based on the population of the countries concerned. The Reuters graph goes beyond the Google data and includes the more recent Twitter and Microsoft/Skype transparency reports. So, I have repeated the same exercise and duplicated their graph with more representative numbers:

User data requests 2012

For comparison, here is the Reuters graph. (Click for a larger version) Reuters-data-requests

There’s quite a difference – the US drops to number 10. Arguably, you could say that Luxembourg and Malta are unreliable data points due to their relatively small size, but that still puts the US at number eight. The raw data is reproduced below.

Rank Country Population Google Microsoft Skype Twitter Total Requests per million people
1 Luxembourg 537,000 0 55 98 0 153 284.9
2 Taiwan 23,174,528 561 4,381 316 0 5,258 226.9
3 United Kingdom 62,008,049 2,883 9,226 1268 36 13,413 216.3
4 Malta 416,055 0 75 5 0 80 192.3
5 France 65,447,374 3,239 8,603 402 12 12,256 187.3
6 Turkey 72,561,312 261 11,434 0 11,695 161.2
7 Australia 22,469,943 1,107 2,238 195 0 3,540 157.5
8 Germany 81,802,257 3,083 8,419 686 0 12,188 149.0
9 Hong Kong 7,173,900 0 1041 0 0 1,041 145.1
10 United States 310,314,000 16,407 11,073 1154 1,494 30,128 97.1
11 Belgium 10,839,905 227 727 39 0 993 91.6
12 Portugal 10,636,888 384 548 1 0 933 87.7
13 Singapore 5,076,700 185 179 4 0 368 72.5
14 Spain 46,072,834 978 1,981 11 0 2,970 64.5
15 Netherlands 16,678,200 59 859 2 0 920 55.2
16 Italy 60,402,499 1,687 1,519 96 0 3,302 54.7
17 Norway 4,985,870 37 187 14 0 238 47.7
18 Chile 17,133,000 210 530 0 740 43.2
19 Sweden 9,580,424 0 326 43 0 369 38.5
20 Denmark 5,574,000 66 128 16 0 210 37.7

It’s that time again, when Google release their Transparency Report and I take a look at the per-capita rather than raw data.

The Google Transparency Report lists the number of requests via the courts or law enforcement, by country, for user data. These are often from governments but might also be in response to court orders – the only contry where this is broken down is the United States where The latest figures this time are for the second half of 2012 (2012 H2) so Google are now rather more up to date than they used to be, when they released data 6 months behind. There is remarkably little to report this time, with most countries maintaining their positions in the chart. Australia and France have swapped places, but remain remarkably close to each other, whilst the UK remains in fourth place.

What we do have now that we’ve not had previously is enough data to make it worthwhile charting the progress of Google user data requests over time. The upward trend in the number of requests per country is obvious, as is the fact that despite dropping to fourth place, there is still a steady rise in the number of requests in the UK – we have only dropped down due to other countries increasing their requests at an even more rapid rate.

Top 8 countries for Google Data Requests Per Capita

Some welcome (On the surface) news today, that the UK is no longer the most spied upon population online, going by Google’s data. The most recent half-yearly Transparency Report shows that, when analysed per-capita, we’ve dropped down into 4th place.

Rank Country Requests 2011H2
1 United States 25.7 3 20.4
2 France 23.6 2 21.5
3 Australia 23.3 5 19.8
4 United Kingdom 23.0 1 23.5
5 Germany 18.7 6 17.4
6 Singapore 17.5 4 20.1
7 Portugal 17.3 8 13.8
8 Italy 13.9 7 14.0
9 Taiwan 11.7 10 9.7
10 Spain 11.5 13 8.4

(Requests refers to the number of user data requests submitted to Google in the half year period, per million people)

Sadly, the real story is a little more depressing. The number of requests in the first half of 2012 has remained relatively static at 23 requests per million people. The UK has lost it’s top spot purely because other countries – the US, France and Australia – have all increased their activity.

China, traditionally regarded as more authoritarian online, remains relatively low down the list coming in at 31st with just 0.1 requests per million. This is probably due to the lower internet usage in that country, coupled with greater state snooping allowing them to figure out users identity without involving Google.

Featured on Liberal Democrat VoiceGoogle released the latest update to their half-yearly Transparency Report today, something I’ve reported on previously. The Google data lists the number of “user data requests” per country, but what it doesn’t do is break it down per head of population.

Doing that breakdown gives depressing results. The UK had slipped into second place behind Singapore in terms of the number of requests per citizen, but as of the latest data – covering the second half of 2011 – we’re back on top. The table below shows the top ten countries, with the number of user data requests per million population. For comparison, I’ve also included the rankings of each country appearing in the top ten for the last couple of years since Google’s records began.

Rank
Country Requests 2011 H1 2010 H2 2010 H1 2009 H2
1 United Kingdom 23.5 2 2 1 2
2 France 21.5 3 3 3 3
3 United States 20.4 4 5 4 5
4 Singapore 20.1 1 1 2 4
5 Australia 19.8 5 4 7 8
6 Germany 17.4 8 7 8 11
7 Italy 14.0 6 6 6 6
8 Portugal 13.8 7 9 10 13
9 Norway 9.8 28 26 22 22
10 Taiwan 9.7 15 16 13 22

You can download the raw data (CSV) used to calculate this from the google figures too.

Remember, this is before the latest government plans come before parliament. We would probably drop off the charts completely if this legislation were to go through as they would no longer have to ask google for the data: The ISPs would be forced to do the snooping instead.

A while ago, I produced a per-capita analysis of the Google privacy data showing that the UK, per citizen, is the most snooped on country – there were more requests per person in the UK to Google than any other country. More up to date data is now available, for July to December 2010, showing that the UK is no longer the most snooped on – we’ve dropped to second place. Singapore does not appear in the January to June data but no reason is indicated for this.

(Note: Previous positions in the table below are based on latest data from Google. Some countries did not have data available at the time the previous blog post was compiled, so those numbers do not match)


Population Previous position Requests per Million (Jan-Jun) Requests per Million (Jul-Dec)
1. Singapore 5,076,700 5th 20.9 23.2
2. United Kingdom 62,008,049 1st 40.5 18.7
3. France 65,447,374 3rd 28.5 15.6
4. Australia 22,469,943 6th 15.8 15.4
5. United States 310,314,000 4th 25.4 14.8
6. Italy 60,402,499 6th 19.9 13.9
7. Germany 81,802,257 13th 5.6 9.4
8. Brazil 193,549,000 2nd 31.5 9.3
9. Portugal 10,636,888 10th 6.9 8.6
10. Belgium 10,839,905 11th 6.5 7.8

And no real surprises in the removal requests category either as Lybia is still an order of magnitude ahead of every other country. The United States, home of free speech, drops out of the top 10 completely down to number 13 while the UK stays up at number six.


Population Previous position Removals per Million (Jan-Jun) Removals per Million (Jul-Dec)
1. Libya 6,546,000 1st 22.8 10.4
2. South Korea 49,773,145 5th 2.0 2.8
3. Germany 81,802,257 2nd 3.8 1.4
4. Brazil 193,549,000 3rd 3.6 1.4
5. Italy 60,402,499 4th 2.1 0.8
6. United Kingdom 62,008,049 6th 1.7 0.6
7. Argentina 40,518,951 8th 1.3 0.5
8. Switzerland 7,866,500 13th 0.6 0.5
9. France 65,447,374 3rd 0.5 0.4
10. Spain 46,072,834 9th 1.0 0.3

Google released their “transparency report” a couple of days ago. There’s been a little coverage of how high the UK is in the chart, but what I haven’t seen is an analysis of the data per head of population. It’s pretty logical that the US would have more requests than the UK, after all they have five times the population. So, here we have it, the top ten countries for government snooping per head of population. Data is for the 12 months from July 2009 to June 2010.


Population Requests Requests per Million
1. United Kingdom 62,008,049 2,509 40.5
2. Brazil 193,549,000 6,098 31.5
3. France 65,447,374 1,863 28.5
4. United States 310,314,000 7,867 25.4
5. Italy 60,402,499 1,201 19.9
6. Australia 22,469,943 355 15.8
7. Spain 46,072,834 696 15.1
8. Chile 17,133,000 225 13.1
9. Belgium 10,827,519 138 12.7
10. Singapore 5,076,700 62 12.2

Removals are harder to count as the numbers are lower and start disappearing into noise, but for completeness, where data is available, here it is:


Population Removals Removals per Million
1. Libya 6,546,000 149 22.8
2. Germany 81,802,257 312 3.8
3. Brazil 193,549,000 689 3.6
4. Italy 60,402,499 126 2.1
5. South Korea 49,773,145 102 2.0
6. United Kingdom 62,008,049 107 1.7
7. Australia 22,469,943 31 1.4
8. Argentina 40,518,951 54 1.3
9. Spain 46,072,834 48 1.0
10. United States 310,314,000 251 0.8